Target
To avoid or minimise water restrictions for Myrtleford, we asked the town to reduce their water usage by 14% to 1,300,000 litres per day over the four week period. The residential target was 505 litres per household per day. At the start of the target period, average household water consumption in Myrtleford was 590 litres per day.
We appreciate the efforts made by the community during this time. With Myrtleford’s water storage currently at its lowest level on record – even lower than during the Millennium Drought – we were hopeful for a strong community-wide response. While we saw some reductions, these were mostly for short periods after rainfall. This shows the majority of town water use is outdoors.
Thankfully, the recent rain has provided some short-term relief and helped boost the Myrtleford storage slightly. However, this improvement is temporary, and we still face challenges ahead.
If water use remains at current levels, and we don’t receive significant rainfall over winter, formal water restrictions may need to be introduced in the coming months.
We’re kindly asking all residents and businesses to continue doing what they can to reduce water use – especially outdoors on gardens and lawns. Every small action adds up and can make a real difference.
We’ll be sharing regular updates on the town’s water storage levels over the coming months to highlight the ongoing importance of conserving water.
The following tables show the town's total daily water usage and houseold only daily average usage.
Week one: Mon 12 - Sun 18 May
| Day |
Town usage |
Daily use per household (average) |
Household % from target |
Household target met |
| Monday |
1,222,800 litres |
434 litres |
- 14% |
✔ |
| Tuesday |
1,993,000 litres |
705 litres |
+ 40% |
X |
| Wednesday |
765,000 litres |
270 litres |
- 46% |
✔ |
| Thursday |
2,035,000 litres |
719 litres |
+ 42% |
X |
| Friday |
1,905,000 litres |
673 litres |
+ 33% |
X |
| Saturday |
1,083,000 litres |
383 litres |
- 24% |
✔ |
| Sunday |
1,385,000 litres |
490 litres |
- 3% |
✔ |
Week two: Mon 19 - Sun 25 May
| Day |
Town usage |
Daily use per household (average) |
Household % from target |
Household target met |
| Monday |
2,027,000 litres |
717 litres |
+ 42% |
X |
| Tuesday |
1,388,000 litres |
491 litres |
- 3% |
✔ |
| Wednesday |
1,517,000 litres |
536 litres |
+ 6% |
X |
| Thursday |
1,508,000 litres |
533 litres |
+ 6% |
X |
| Friday |
1,169,000 litres |
413 litres |
- 18% |
✔ |
| Saturday |
1,272,000 litres |
450 litres |
- 11% |
✔ |
| Sunday |
1,237,000 litres |
437 litres |
- 13% |
✔ |
Week three: Mon 26 May - Sun 1 Jun
| Day |
Town usage |
Daily use per household (average) |
Household % from target |
Household target met |
| Monday |
1,546,000 litres |
547 litres |
+ 8% |
X |
| Tuesday |
719,000 litres |
254 litres |
- 50% |
✔ |
| Wednesday |
1,198,000 litres |
424 litres |
- 16% |
✔ |
| Thursday |
1,382,000 litres |
489 litres |
- 3% |
✔ |
| Friday |
1,765,000 litres |
624 litres |
+ 24% |
X |
| Saturday |
619,000 litres |
219 litres |
- 57% |
✔ |
| Sunday |
1,300,000 litres |
460 litres |
- 9% |
✔ |
Week four: Mon 2 - Sun 8 Jun
| Day |
Town usage |
Daily use per household (average) |
Household % from target |
Household target met |
| Monday |
1,137,000 litres |
402 litres |
- 20% |
✔ |
| Tuesday |
1,120,000 litres |
396 litres |
- 22% |
✔ |
| Wednesday |
1,394,000 litres |
493 litres |
- 2% |
✔ |
| Thursday |
1,536,000 litres |
543 litres |
+ 8% |
X |
| Friday |
755,000 litres |
267 litres |
- 47% |
✔ |
| Saturday |
1,465,000 litres |
479 litres |
- 5% |
✔ |
| Sunday |
1,356,000 litres |
290 litres |
- 43% |
✔ |
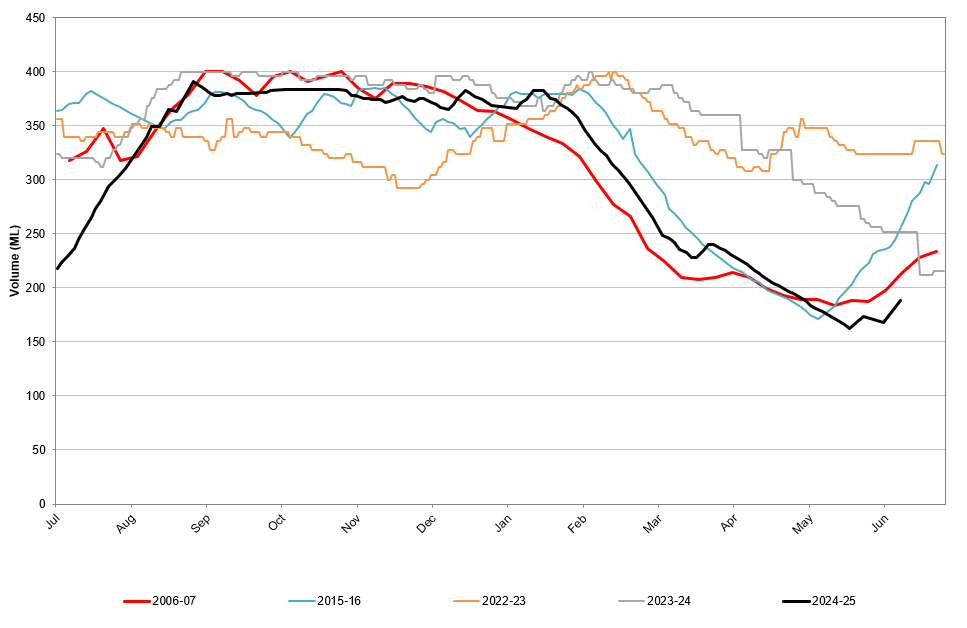
The graph below that shows Myrtleford's storage levels. It has the last 3 years of actual volumes compared to 2006/07 (“worst year on record”) and 2015-16 (similar dry period):